
UniRide - Campus Carpooling App
UniRide - Campus Carpooling App
UniRide - Campus Carpooling App
End-to-End Product Design (UX) Case Study
End-to-End Product Design (UX) Case Study
End-to-End Product Design (UX) Case Study
A campus carpool experience designed for safer, convenient, and affordable commutes.
A campus carpool experience designed for safer, convenient, and affordable commutes.
A campus carpool experience designed for safer, convenient, and affordable commutes.
Reducing long commute times and high commuting costs.
Reducing long commute times and high commuting costs.
Reducing long commute times and high commuting costs.

Project Overview
Project Overview
Project Overview
Project type
Project type
Project type
Mobile App
Mobile App
Mobile App
Timeline
Timeline
Timeline
Sep - Nov 2025 (3 months)
Sep - Nov 2025 (3 months)
Sep - Nov 2025 (3 months)
Role
Role
Role
UX Designer, UX Researcher
UX Designer,
UX Researcher
UX Designer, UX Researcher
Challenges
Challenges
Challenges
Applying research methods and design standards in my first end-to-end UX project meant every step was new and challenging, and I had to reflect at each phase on whether I had done it right, whether it was complete, and what the next step should be before moving forward.
Applying research methods and design standards in my first end-to-end UX project meant every step was new and challenging, and I had to reflect at each phase on whether I had done it right, whether it was complete, and what the next step should be before moving forward.
Applying research methods and design standards in my first end-to-end UX project meant every step was new and challenging, and I had to reflect at each phase on whether I had done it right, whether it was complete, and what the next step should be before moving forward.
Intercept recruiting felt challenging initially, and the project timelines pushed me to step up, approach students on campus, and collect interviews and survey responses.
Intercept recruiting felt challenging initially, and the project timelines pushed me to step up, approach students on campus, and collect interviews and survey responses.
Intercept recruiting felt challenging initially, and the project timelines pushed me to step up, approach students on campus, and collect interviews and survey responses.
A design challenge was balancing privacy and trust. Users needed enough info from others to trust them (e.g., age, student number), but interviews showed some students didn’t want sensitive details shown publicly, so trust had to be built through other design signals.
A design challenge was balancing privacy and trust. Users needed enough info from others to trust them (e.g., age, student number), but interviews showed some students didn’t want sensitive details shown publicly, so trust had to be built through other design signals.
A design challenge was balancing privacy and trust. Users needed enough info from others to trust them (e.g., age, student number), but interviews showed some students didn’t want sensitive details shown publicly, so trust had to be built through other design signals.
What I learned
What I learned
What I learned
Learned from doing it end-to-end how to build a mixed-method research workflow by using interview themes to shape deeper interviews, then turning key themes into survey variables to measure at scale.
Learned from doing it end-to-end how to build a mixed-method research workflow by using interview themes to shape deeper interviews, then turning key themes into survey variables to measure at scale.
Learned from doing it end-to-end how to build a mixed-method research workflow by using interview themes to shape deeper interviews, then turning key themes into survey variables to measure at scale.
Learned how to turn mixed-method research into real user experiences by prioritizing key findings and translating them into specific design decisions.
Learned how to turn mixed-method research into real user experiences by prioritizing key findings and translating them into specific design decisions.
Learned how to turn mixed-method research into real user experiences by prioritizing key findings and translating them into specific design decisions.
Learned to run usability tests early and iterate fast to catch issues sooner and avoid costly rework later.
Learned to run usability tests early and iterate fast to catch issues sooner and avoid costly rework later.
Learned to run usability tests early and iterate fast to catch issues sooner and avoid costly rework later.
Learned to reflect on my research and design at each step, improve visual hierarchy, reduce visual noise, make the UI better.
Learned to reflect on my research and design at each step, improve visual hierarchy, reduce visual noise, make the UI better.
Learned to reflect on my research and design at each step, improve visual hierarchy, reduce visual noise, make the UI better.
Background
Background
Background
Ottawa is a city pretty spread out, with a lot of communities far from campus, like Barrhaven, Kanata, and Orléans.
Ottawa is a city pretty spread out, with a lot of communities far from campus, like Barrhaven, Kanata, and Orléans.
Ottawa is a city pretty spread out, with a lot of communities far from campus, like Barrhaven, Kanata, and Orléans.
Students who rely on transit are often forced into 1 - 2 hour commutes with multiple transfers, while student drivers face high gas and high parking costs. Daily commuting has become a significant strain on students’ time, energy, and financial resources.
Students who rely on transit are often forced into 1 - 2 hour commutes with multiple transfers, while student drivers face high gas and high parking costs. Daily commuting has become a significant strain on students’ time, energy, and financial resources.
Students who rely on transit are often forced into 1 - 2 hour commutes with multiple transfers, while student drivers face high gas and high parking costs. Daily commuting has become a significant strain on students’ time, energy, and financial resources.
This makes carpooling a practical way to reduce both time and cost.
This makes carpooling a practical way to reduce both time and cost.
This makes carpooling a practical way to reduce both time and cost.


Intercept Interviews
Intercept Interviews
Intercept Interviews
I started with intercept interviews at campus bus stops and parking lots to understand how students feel about carpooling. I intercepted students (n > 30) using convenience sampling to capture their real-time attitudes toward campus carpooling.
Many students expressed strong interest in carpooling, validating the early need for a campus carpooling solution, but their biggest concern was riding with a stranger, someone they don’t know.
On-site at campus bus stops and parking lots, I intercepted students (n > 30) using convenience sampling to capture their real-time attitudes toward campus carpooling and explore a wide range of initial opinions.
Many students expressed strong interest in carpooling, validating the early need for a campus carpooling solution, but their biggest concern was riding with a stranger, someone they don’t know.
I started with intercept interviews at campus bus stops and parking lots to understand how students feel about carpooling. I intercepted students (n > 30) using convenience sampling to capture their real-time attitudes toward campus carpooling.
Many students expressed strong interest in carpooling, validating the early need for a campus carpooling solution, but their biggest concern was riding with a stranger, someone they don’t know.
Transit Riders
Transit Riders
Transit Riders

“Basically, you don't know people that you're going to be riding with.”
“Basically, you don't know people that you're going to be riding with.”
“Basically, you don't know people that you're going to be riding with.”
“This would be a dream. My bus is late almost every day.”
“This would be a dream. My bus is late almost every day.”
“This would be a dream. My bus is late almost every day.”
Drivers
Drivers
Drivers
“If someone could split gas and parking with me, that would make things much easier.”
“If someone could split gas and parking with me, that would make things much easier.”
“If someone could split gas and parking with me, that would make things much easier.”
“Yeah, I'd be down to that, as long as I like met the person before and something like that.”
“Yeah, I'd be down to that, as long as I like met the person before and something like that.”
“Yeah, I'd be down to that, as long as I like met the person before and something like that.”
Affinity Mapping
Affinity Mapping
Affinity Mapping
After organizing the intercept interviews through affinity mapping, no new themes emerged, indicating early data saturation. The synthesis revealed six key themes:
After organizing the intercept interviews through affinity mapping, no new themes emerged, indicating early data saturation. The synthesis revealed six key themes:
After organizing the intercept interviews through affinity mapping, no new themes emerged, indicating early data saturation. The synthesis revealed six key themes:
Safety
Safety
Safety
Privacy & Control
Privacy & Control
Privacy & Control
Social Experience
Social Experience
Social Experience
Predictability
Predictability
Predictability
Cost & Financial Incentives
Cost & Financial Incentives
Cost & Financial Incentives
Eco-values
Eco-values
Eco-values

Problem Statement
Problem Statement
Problem Statement
Students like the idea of carpooling for convenience and cost savings, but concerns around safety, privacy, and social comfort prevent them from riding with unfamiliar classmates.
Students like the idea of carpooling for convenience and cost savings, but concerns around safety, privacy, and social comfort prevent them from riding with unfamiliar classmates.
Students like the idea of carpooling for convenience and cost savings, but concerns around safety, privacy, and social comfort prevent them from riding with unfamiliar classmates.
Semi-Structured Interviews
Semi-Structured Interviews
Semi-Structured Interviews
Based on my intercept interviews, I captured strong breadth but limited depth. Convenience sampling also likely over-represented outgoing students, so I may have missed more cautious or introverted perspectives.
Next, I conducted semi-structured interviews using purposive sampling. Based on the themes from my intercept interviews, I recruited students with different personalities and conducted 8 in-depth interviews to better understand those themes.
Safety
Safety
Safety
Across all interviews, students repeatedly expressed: “If I trust the person, I feel safe.” “At least I need to know they’re a student.”
Across all interviews, students repeatedly expressed: “If I trust the person, I feel safe.” “At least I need to know they’re a student.”
Across all interviews, students repeatedly expressed: “If I trust the person, I feel safe.” “At least I need to know they’re a student.”
In discussions with students about trust, participants said the minimum trust threshold was verifying a school email and using a real profile photo.
In discussions with students about trust, participants said the minimum trust threshold was verifying a school email and using a real profile photo.
In discussions with students about trust, participants said the minimum trust threshold was verifying a school email and using a real profile photo.
Female students strongly preferred same-gender rides, as riding with someone of the same gender made them feel much safer.
Female students strongly preferred same-gender rides, as riding with someone of the same gender made them feel much safer.
Female students strongly preferred same-gender rides, as riding with someone of the same gender made them feel much safer.
Predictability
Predictability
Predictability
In interviews, two uncertainties kept coming up: Does the schedule match? and Do I feel comfortable with this person?
In interviews, two uncertainties kept coming up: Does the schedule match? and Do I feel comfortable with this person?
In interviews, two uncertainties kept coming up: Does the schedule match? and Do I feel comfortable with this person?
Students wanted to see weekly schedules to check if the ride would work most days, not just once.
Students wanted to see weekly schedules to check if the ride would work most days, not just once.
Students wanted to see weekly schedules to check if the ride would work most days, not just once.
Students wanted more clarity on who they would be riding with to avoid uncomfortable matches.
Students wanted more clarity on who they would be riding with to avoid uncomfortable matches.
Students wanted more clarity on who they would be riding with to avoid uncomfortable matches.
Social
Social
Social
Students were more willing to carpool with someone from the same program or a familiar face on campus, showing that trust comes from shared identity and familiarity, not just verification.
Students were more willing to carpool with someone from the same program or a familiar face on campus, showing that trust comes from shared identity and familiarity, not just verification.
Students were more willing to carpool with someone from the same program or a familiar face on campus, showing that trust comes from shared identity and familiarity, not just verification.
Some students said rides can feel awkward when one person wants to chat but the other prefers quiet, the awkwardness often comes from unclear expectations.
Some students said rides can feel awkward when one person wants to chat but the other prefers quiet, the awkwardness often comes from unclear expectations.
Some students said rides can feel awkward when one person wants to chat but the other prefers quiet, the awkwardness often comes from unclear expectations.
Privacy
Privacy
Privacy
Students didn’t want personal details like an address to be public, but they were okay sharing them with the matched person once the match was confirmed.
Students didn’t want personal details like an address to be public, but they were okay sharing them with the matched person once the match was confirmed.
Students didn’t want personal details like an address to be public, but they were okay sharing them with the matched person once the match was confirmed.
Eco-values
Eco-values
Eco-values
Some students said they carpooled “for the environment,” but this often seemed tied to eco-friendly identity and social desirability, so I treated environmental impact as a secondary motivator.
Some students said they carpooled “for the environment,” but this often seemed tied to eco-friendly identity and social desirability, so I treated environmental impact as a secondary motivator.
Some students said they carpooled “for the environment,” but this often seemed tied to eco-friendly identity and social desirability, so I treated environmental impact as a secondary motivator.
How Might We
How Might We
How Might We
How might we support students in building trust when carpooling with unfamiliar classmates?
How might we support students in building trust when carpooling with unfamiliar classmates?
How might we support students in building trust when carpooling with unfamiliar classmates?
How might we let students check both schedule fit and person fit before confirming a carpool match?
How might we let students check both schedule fit and person fit before confirming a carpool match?
How might we let students check both schedule fit and person fit before confirming a carpool match?
How might we enable students to see how far apart they are without revealing exact addresses before a match is confirmed?
How might we enable students to see how far apart they are without revealing exact addresses before a match is confirmed?
How might we enable students to see how far apart they are without revealing exact addresses before a match is confirmed?
Quantitative Validation
Quantitative Validation
Quantitative Validation
After interviews, I had clear qualitative insights, but with a small sample, I couldn’t generalize to all students, so I ran a survey to validate the findings at scale.
I used convenience sampling across Ottawa campuses (Algonquin and Carleton) by recruiting in libraries and cafeterias and sharing the survey in Discord groups, and a coffee incentive helped me collect 205 valid responses (after removing incomplete or inconsistent entries).

From Raw Data to Insights
From Raw Data to Insights
From Raw Data to Insights
Who’s the user
Who’s the user
Who’s the user
61.5% of students rely on transit, and 38.5% drive. Even though drivers are the smaller group, they’re the supply side of carpooling.
61.5% of students rely on transit, and 38.5% drive. Even though drivers are the smaller group, they’re the supply side of carpooling.
61.5% of students rely on transit, and 38.5% drive. Even though drivers are the smaller group, they’re the supply side of carpooling.
52% of respondents were female, Female students are a large group, so have to focus on female students’ needs, like same-gender rides.
52% of respondents were female, Female students are a large group, so have to focus on female students’ needs, like same-gender rides.
52% of respondents were female, Female students are a large group, so have to focus on female students’ needs, like same-gender rides.
84% of students commute 3 - 5 days a week, which indicates a need to support stable, predictable weekly matches, not just one-off rides.
84% of students commute 3 - 5 days a week, which indicates a need to support stable, predictable weekly matches, not just one-off rides.
84% of students commute 3 - 5 days a week, which indicates a need to support stable, predictable weekly matches, not just one-off rides.

Transit
Transit
Transit
61.5%
61.5%
61.5%
Transit
Transit
Transit
61.5%
61.5%
61.5%
Driving
Driving
Driving
38.5%
38.5%
38.5%
Primary Role
Primary Role
Primary Role
Female
Female
Female
52.2%
52.2%
52.2%
Non-binary/Not to say
Non-binary/Not to say
Non-binary/Not to say
7.3%
7.3%
7.3%
Female
Female
Female
52.2%
52.2%
52.2%
Male
Male
Male
40.5%
40.5%
40.5%
Gender
Gender
Gender
3-5 Days
3-5 Days
3-5 Days
84.4%
84.4%
84.4%
1-2 Days
1-2 Days
1-2 Days
15.6%
15.6%
15.6%
3-5 Days
3-5 Days
3-5 Days
84.4%
84.4%
84.4%
Commute Frequency
Commute Frequency
Commute Frequency
What drives willingness to carpool?
What drives willingness to carpool?
What drives willingness to carpool?
In the regression results, trust showed the strongest relationship with willingness to carpool (β = .339).
In the regression results, trust showed the strongest relationship with willingness to carpool (β = .339).
In the regression results, trust showed the strongest relationship with willingness to carpool (β = .339).
After trust, the next strongest drivers were cost savings (β = .267) and predictability (β = .249), showing students value a balance, not just the cheapest or the most convenient option.
After trust, the next strongest drivers were cost savings (β = .267) and predictability (β = .249), showing students value a balance, not just the cheapest or the most convenient option.
After trust, the next strongest drivers were cost savings (β = .267) and predictability (β = .249), showing students value a balance, not just the cheapest or the most convenient option.
Social connection cues (β = .148, p = .005) and Eco-values (β = .134, p = .012) had smaller but still statistically significant effects, acting as bonus motivators.
Social connection cues (β = .148, p = .005) and Eco-values (β = .134, p = .012) had smaller but still statistically significant effects, acting as bonus motivators.
Social connection cues (β = .148, p = .005) and Eco-values (β = .134, p = .012) had smaller but still statistically significant effects, acting as bonus motivators.
Multiple Regression - Beta Coefficients (β)
Multiple Regression - Beta Coefficients (β)
0.4
0.4
0.4
0.3
0.3
0.3
0.2
0.2
0.2
0.1
0.1
0.1
0
0
0
0.339
0.339
0.339
Trust
Trust
Trust
0.267
0.267
0.267
Cost & Financial Incentives
Cost & Financial Incentives
Cost & Financial Incentives
0.249
0.249
0.249
Predictable
Predictable
Predictable
0.148
0.148
0.148
Social Connection
Social Connection
Social Connection
0.134
0.134
0.134
Eco-values
Eco-values
Eco-values
Multiple Regression - Beta Coefficients (β)
Does social connection matter?
Does social connection matter?
Does social connection matter?
When I looked at social connection, it didn’t have a very strong effect on willingness overall(r = .418). But when I split the data by gender, the effect became much stronger for women(r = .607) and much weaker for men(r = .182). And because female students are over half of the users, this made social connection an important part of the design.
When I looked at social connection, it didn’t have a very strong effect on willingness overall(r = .418). But when I split the data by gender, the effect became much stronger for women(r = .607) and much weaker for men(r = .182). And because female students are over half of the users, this made social connection an important part of the design.
When I looked at social connection, it didn’t have a very strong effect on willingness overall(r = .418). But when I split the data by gender, the effect became much stronger for women(r = .607) and much weaker for men(r = .182). And because female students are over half of the users, this made social connection an important part of the design.
1
1
1
0.8
0.8
0.8
0.6
0.6
0.6
0.4
0.4
0.4
0.2
0.2
0.2
0
0
0
0.418
0.418
0.418
0.607
0.607
0.607
0.182
0.182
0.182
Overall
Overall
Overall
Female
Female
Female
Male
Male
Male
Pearson Correlation (r)
Pearson Correlation (r)
Pearson Correlation (r)
What influences the ride experience?
What influences the ride experience?
What influences the ride experience?
Students strongly preferred knowing whether others wanted to chat or stay quiet during the ride to reduce social awkwardness.
Students strongly preferred knowing whether others wanted to chat or stay quiet during the ride to reduce social awkwardness.
Students strongly preferred knowing whether others wanted to chat or stay quiet during the ride to reduce social awkwardness.
68.2% of female respondents preferred same-gender ride options.
68.2% of female respondents preferred same-gender ride options.
68.2% of female respondents preferred same-gender ride options.
62% of students preferred staged privacy, sharing limited details at first and sharing an address only after matching.
62% of students preferred staged privacy, sharing limited details at first and sharing an address only after matching.
62% of students preferred staged privacy, sharing limited details at first and sharing an address only after matching.
Research-Driven Design Decisions
Research-Driven Design Decisions
Research-Driven Design Decisions
Trust & Safety
Trust & Safety
Trust & Safety
Built trust with school email verification, real photos, and clear profile activity, also same-gender matching for female students.
Built trust with school email verification, real photos, and clear profile activity, also same-gender matching for female students.
Built trust with school email verification, real photos, and clear profile activity, also same-gender matching for female students.
Predictability
Predictability
Predictability
Display each user’s weekly commute schedule to help students find stable weekly matches.
Display each user’s weekly commute schedule to help students find stable weekly matches.
Display each user’s weekly commute schedule to help students find stable weekly matches.
Display keyword tags from past ride feedback and ride-preference tags so students can quickly understand who they would be riding with before matching.
Display keyword tags from past ride feedback and ride-preference tags so students can quickly understand who they would be riding with before matching.
Display keyword tags from past ride feedback and ride-preference tags so students can quickly understand who they would be riding with before matching.
Social Connection
Social Connection
Social Connection
Let students signal “chatty” or “quiet” before matching to reduce social awkwardness during the ride.
Let students signal “chatty” or “quiet” before matching to reduce social awkwardness during the ride.
Let students signal “chatty” or “quiet” before matching to reduce social awkwardness during the ride.
Add lightweight cues like program and shared connections that build familiarity and increase willingness to carpool.
Add lightweight cues like program and shared connections that build familiarity and increase willingness to carpool.
Add lightweight cues like program and shared connections that build familiarity and increase willingness to carpool.
Staged Privacy
Staged Privacy
Staged Privacy
Use staged privacy by showing only a general distance range and route overlap percentage before matching, then sharing exact addresses after matching was confirmed.
Use staged privacy by showing only a general distance range and route overlap percentage before matching, then sharing exact addresses after matching was confirmed.
Use staged privacy by showing only a general distance range and route overlap percentage before matching, then sharing exact addresses after matching was confirmed.
Eco-values
Eco-values
Eco-values
Display CO₂ saved feedback as a secondary motivator.
Display CO₂ saved feedback as a secondary motivator.
Display CO₂ saved feedback as a secondary motivator.
Refining the Sitemap
Refining the Sitemap
Refining the Sitemap
Based on research, I built the sitemap, iterated on it, and after several updates, I ran tree testing (n=5), and every student could complete the key tasks.
Based on research, I built the sitemap, iterated on it, and after several updates, I ran tree testing (n=5), and every student could complete the key tasks.
Based on research, I built the sitemap, iterated on it, and after several updates, I ran tree testing (n=5), and every student could complete the key tasks.


Key User Flow
Key User Flow
Key User Flow
By mapping out core user flows, I clarified the most critical interaction paths and decision points in the campus carpool experience, ensuring that each step feels intuitive and aligns with students’ goals.
By mapping out core user flows, I clarified the most critical interaction paths and decision points in the campus carpool experience, ensuring that each step feels intuitive and aligns with students’ goals.
By mapping out core user flows, I clarified the most critical interaction paths and decision points in the campus carpool experience, ensuring that each step feels intuitive and aligns with students’ goals.

Wireframes & Mid-Fi Testing
Wireframes & Mid-Fi Testing
Wireframes & Mid-Fi Testing
I sketched wireframes based on the core flows for searching, joining, and posting rides, mapping the key screens and interactions. I then turned these into a mid-fidelity prototype in Figma and ran quick usability tests by randomly asking students in the campus library and cafe to complete key tasks (n=8).
I sketched wireframes based on the core flows for searching, joining, and posting rides, mapping the key screens and interactions. I then turned these into a mid-fidelity prototype in Figma and ran quick usability tests by randomly asking students in the campus library and cafe to complete key tasks (n=8).
I sketched wireframes based on the core flows for searching, joining, and posting rides, mapping the key screens and interactions. I then turned these into a mid-fidelity prototype in Figma and ran quick usability tests by randomly asking students in the campus library and cafe to complete key tasks (n=8).


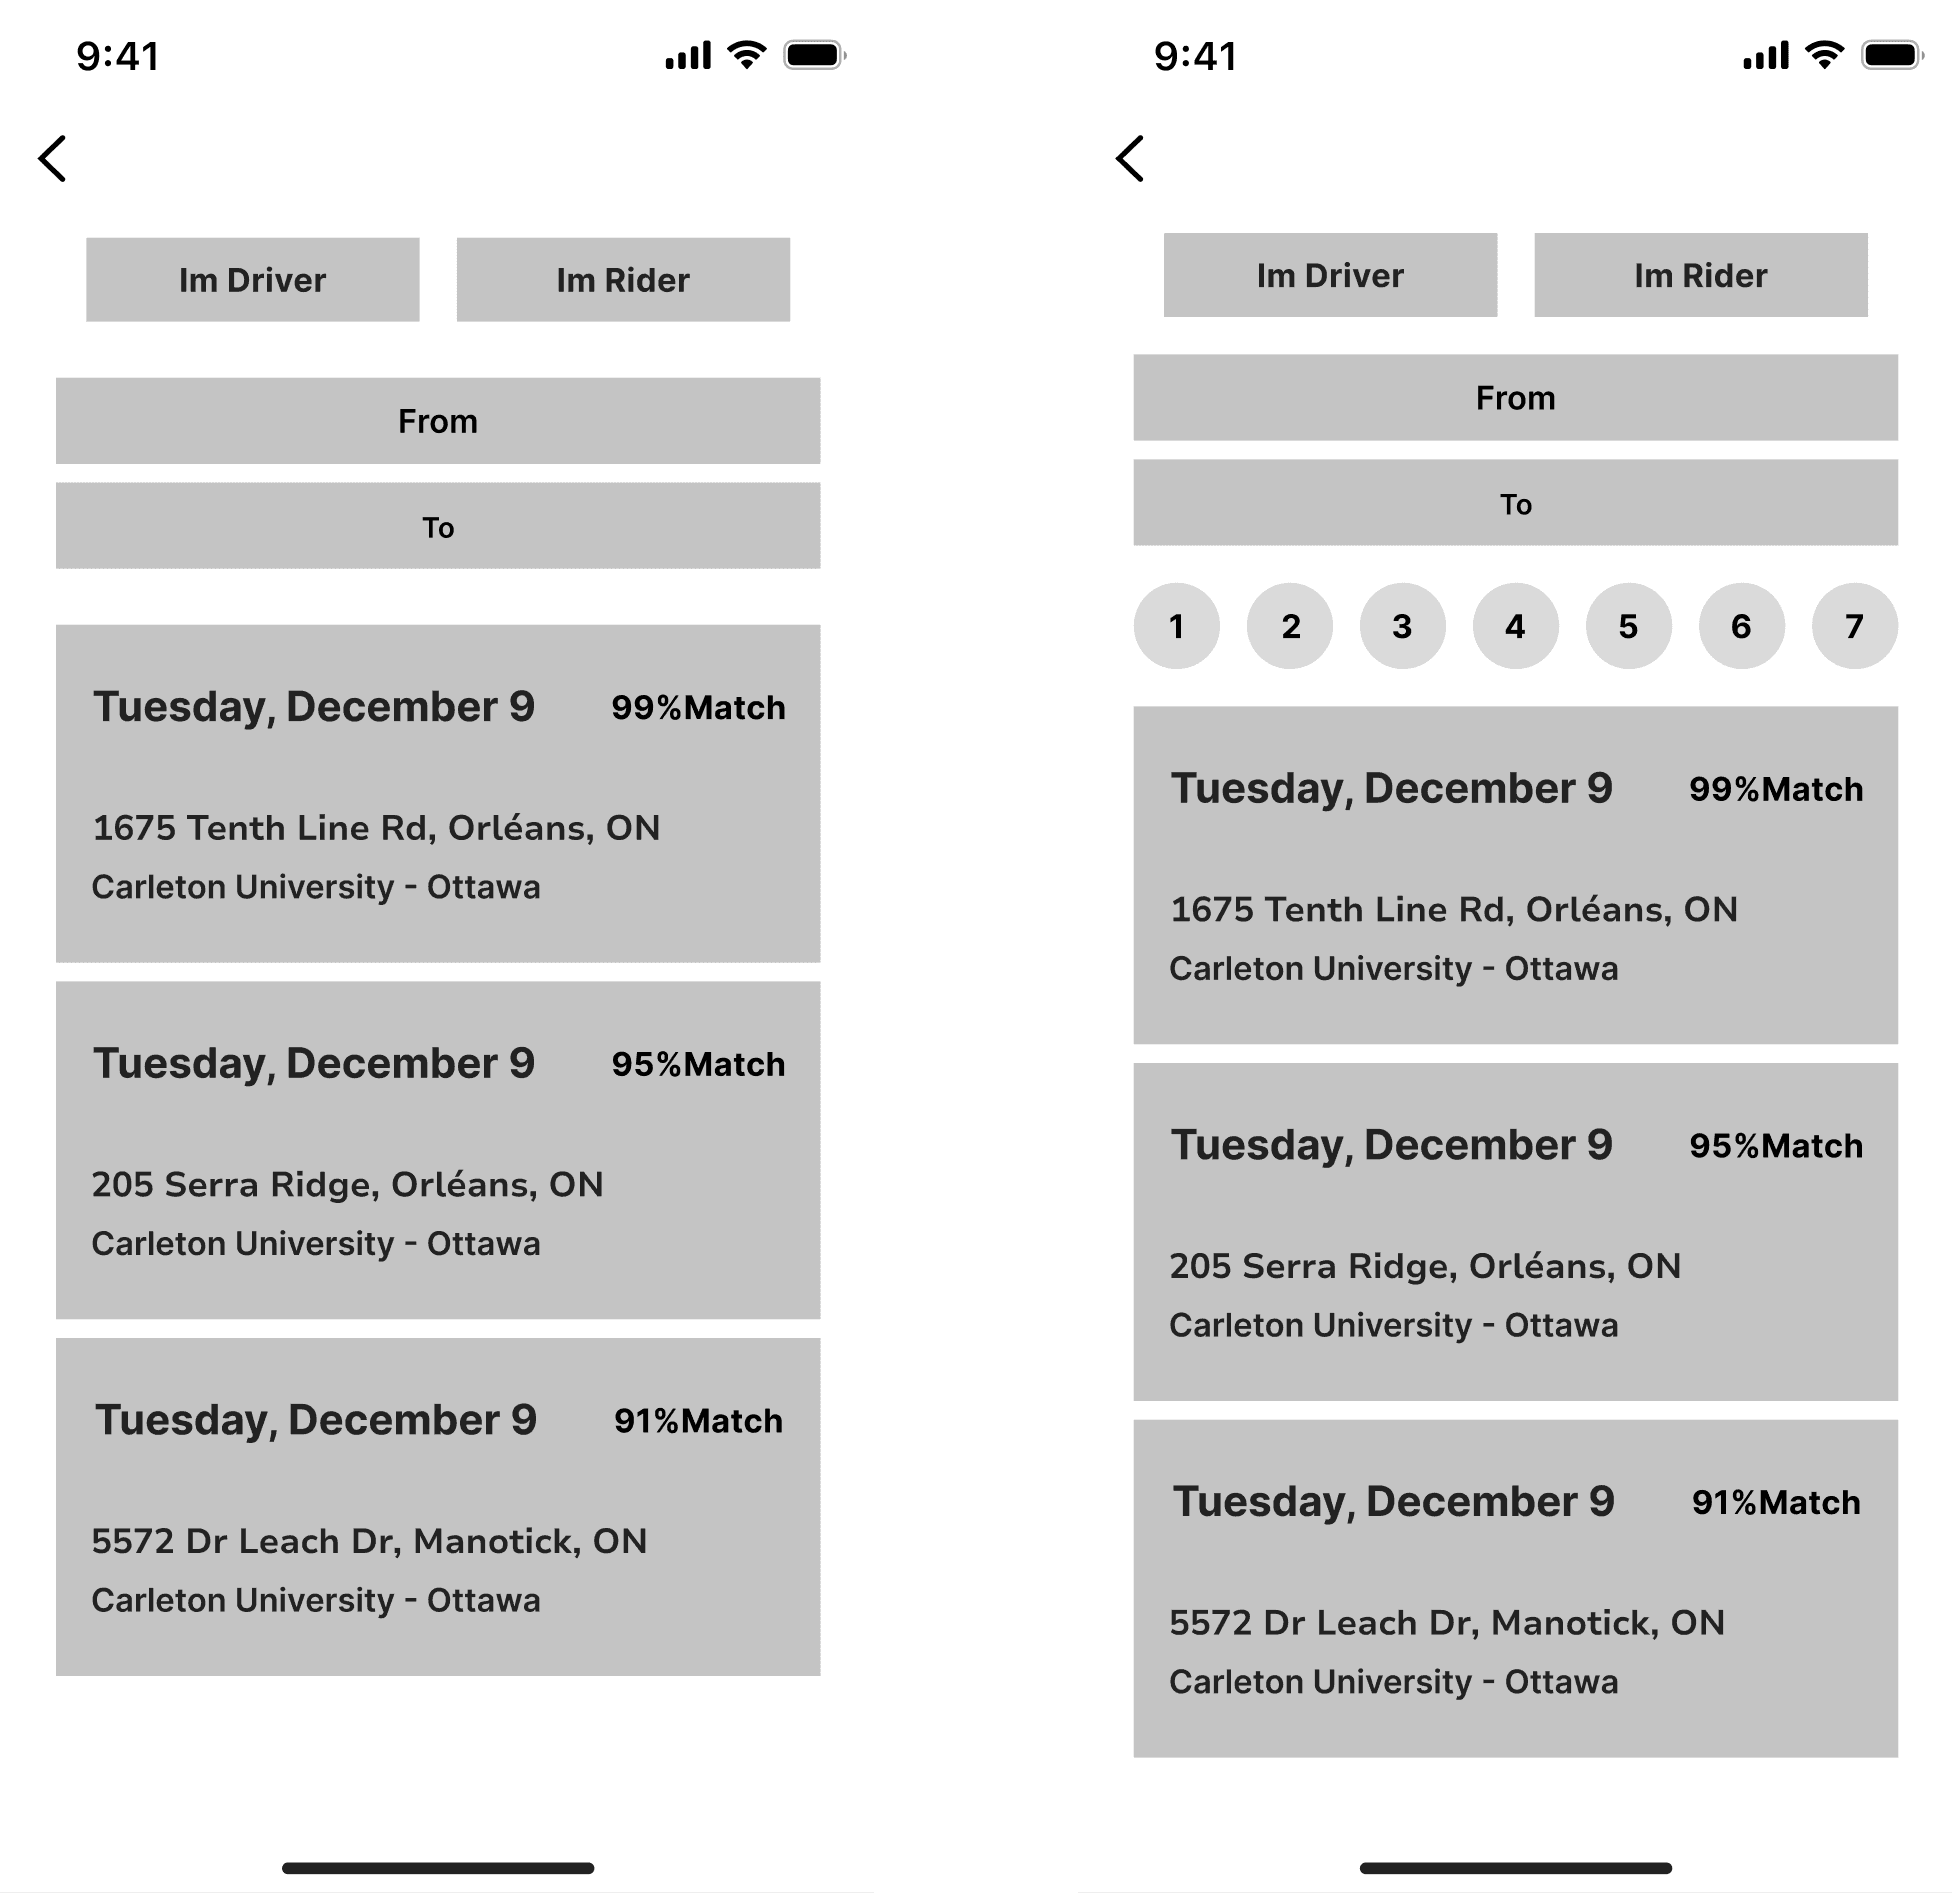
In mid-fidelity testing, students said that after searching for a ride, if they wanted to check the next day or the day after next day, they had to go back to the home page and search again. In response, I added a nearby date selector on the search results page.
After that change, I tested again, and all the participants followed the expected click paths and completed the tasks successfully.

Hi-Fi Design Iterations
Hi-Fi Design Iterations
Hi-Fi Design Iterations
In the high-fidelity iterations, I initially tried to save home screen space by hiding the search steps behind a tap. After reflecting on the flow, I realized students needed faster access, so I removed the extra steps and simplified search into a single address selection. I also redesigned the layout to save space and added a clear Driver or Rider choice.
In the high-fidelity iterations, I initially tried to save home screen space by hiding the search steps behind a tap. After reflecting on the flow, I realized students needed faster access, so I removed the extra steps and simplified search into a single address selection. I also redesigned the layout to save space and added a clear Driver or Rider choice.
In the high-fidelity iterations, I initially tried to save home screen space by hiding the search steps behind a tap. After reflecting on the flow, I realized students needed faster access, so I removed the extra steps and simplified search into a single address selection. I also redesigned the layout to save space and added a clear Driver or Rider choice.

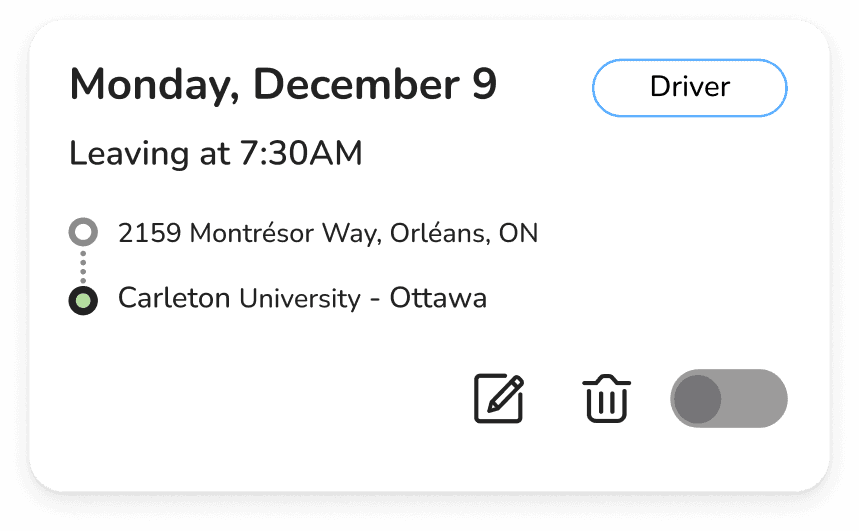
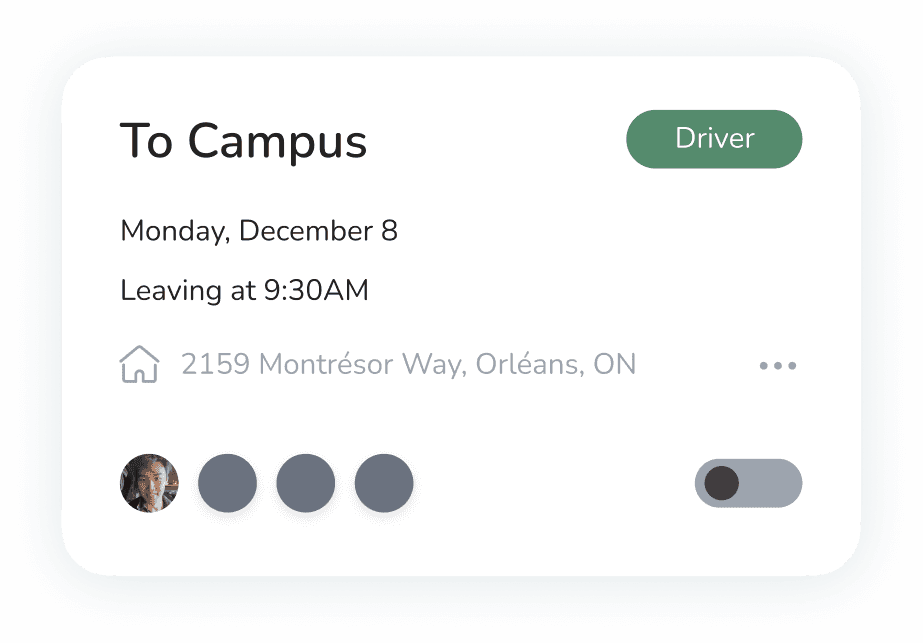
I iterated on the card design by improving the visual hierarchy and reducing color noise. I also removed traditional origin and destination fields since campus carpools share the same campus, making key info clearer and easier to scan.
I iterated on the card design by improving the visual hierarchy and reducing color noise. I also removed traditional origin and destination fields since campus carpools share the same campus, making key info clearer and easier to scan.
I iterated on the card design by improving the visual hierarchy and reducing color noise. I also removed traditional origin and destination fields since campus carpools share the same campus, making key info clearer and easier to scan.

Before
Before
Before


After
After
After


Before
Before
Before
After
After
After
High-Fidelity Design
High-Fidelity Design
High-Fidelity Design

1
1
1
2
2
2
3
3
3
Direct trip search on the home screen with minimal steps.
Direct trip search on the home screen with minimal steps.
Direct trip search on the home screen with minimal steps.
Show upcoming rides on the home screen because it’s key information for managing weekly trips, helping students plan and avoid missed rides.
Show upcoming rides on the home screen because it’s key information for managing weekly trips, helping students plan and avoid missed rides.
Show upcoming rides on the home screen because it’s key information for managing weekly trips, helping students plan and avoid missed rides.
Showed CO₂ saved as a secondary motivator using a simple “trees planted” equivalent.
Showed CO₂ saved as a secondary motivator using a simple “trees planted” equivalent.
Showed CO₂ saved as a secondary motivator using a simple “trees planted” equivalent.

5
5
5
4
4
4

4
4
4
4
4
4
6
6
6
7
7
7
Show route-overlap percentage and a blurred area map to solve the “privacy vs. distance uncertainty” problem before matching, without revealing exact addresses.
Show route-overlap percentage and a blurred area map to solve the “privacy vs. distance uncertainty” problem before matching, without revealing exact addresses.
Show route-overlap percentage and a blurred area map to solve the “privacy vs. distance uncertainty” problem before matching, without revealing exact addresses.
Designed a clear “Same gender only” label to support female students who prefer same-gender rides.
Designed a clear “Same gender only” label to support female students who prefer same-gender rides.
Designed a clear “Same gender only” label to support female students who prefer same-gender rides.
Added review keyword tags so students can quickly understand what a rider is like without reading full comments, improving person-fit predictability before confirming a match.
Added review keyword tags so students can quickly understand what a rider is like without reading full comments, improving person-fit predictability before confirming a match.
Added review keyword tags so students can quickly understand what a rider is like without reading full comments, improving person-fit predictability before confirming a match.
Show ride preferences in advance so students can align expectations before matching and avoid social awkwardness.
Show ride preferences in advance so students can align expectations before matching and avoid social awkwardness.
Show ride preferences in advance so students can align expectations before matching and avoid social awkwardness.
Interviews and survey data showed that familiarity matters, especially for women, so the profile highlights program and mutual connections as quick social cues before matching.
Interviews and survey data showed that familiarity matters, especially for women, so the profile highlights program and mutual connections as quick social cues before matching.
Interviews and survey data showed that familiarity matters, especially for women, so the profile highlights program and mutual connections as quick social cues before matching.
Showed rides completed and days on the platform as trust signals to reduce uncertainty before matching.
Showed rides completed and days on the platform as trust signals to reduce uncertainty before matching.
Showed rides completed and days on the platform as trust signals to reduce uncertainty before matching.
Showed weekly commute availability on profiles so students can quickly check schedule fit and find a regular carpool partner.
Showed weekly commute availability on profiles so students can quickly check schedule fit and find a regular carpool partner.
Showed weekly commute availability on profiles so students can quickly check schedule fit and find a regular carpool partner.

9
8
8
8
8
9
8
8
8
8
9
8
8
8
8


10
10
10
Final High-Fi Screens
Final High-Fi Screens
Final High-Fi Screens

Final Prototype
Final Prototype
Final Prototype
Design System
Design System
Design System
Color
Color
Color
Primary
Primary
Primary
Background
Background
Background
Semantic
Semantic
Semantic
Text
Text
Text
Grid Structure
Grid Structure
Grid Structure
Mobile
Mobile
Mobile
Columns: 4
Columns: 4
Columns: 4
Margin: 24
Margin: 24
Margin: 24
Gutter: 16
Gutter: 16
Gutter: 16
Spacing Scale
Spacing Scale
Spacing Scale
4
4
4
8
8
8
16
16
16
24
24
24
32
32
32
40
40
40
Typography
Typography
Typography
Display
Display
Display
Nunito/SemiBold 30
Nunito/SemiBold 30
Nunito/SemiBold 30
H1
H1
H1
Nunito/SemiBold 24
Nunito/SemiBold 24
Nunito/SemiBold 24
H2
H2
H2
Nunito/SemiBold 20
Nunito/SemiBold 20
Nunito/SemiBold 20
H3
H3
H3
Nunito/SemiBold 16
Nunito/SemiBold 16
Nunito/SemiBold 16
Body
Body
Body
Nunito/Medium 14
Nunito/Medium 14
Nunito/Medium 14
Label
Label
Label
Nunito/Regular 12
Nunito/Regular 12
Nunito/Regular 12
Components
Components
Components

Iconography
Iconography
Iconography
24 px
24 px
24 px
20 px
20 px
20 px
16 px
16 px
16 px
Next steps
Next steps
Next steps
Validate in real commutes, run contextual inquiry during pickup, wait, ride with a 1 - 2 week diary study to capture time pressure, last-minute changes, and social dynamics.
Validate in real commutes, run contextual inquiry during pickup, wait, ride with a 1 - 2 week diary study to capture time pressure, last-minute changes, and social dynamics.
Validate in real commutes, run contextual inquiry during pickup, wait, ride with a 1 - 2 week diary study to capture time pressure, last-minute changes, and social dynamics.
Research and Design for tricky situations like late arrivals, no-shows, and reporting to keep the experience safe and predictable when plans change.
Research and Design for tricky situations like late arrivals, no-shows, and reporting to keep the experience safe and predictable when plans change.
Research and Design for tricky situations like late arrivals, no-shows, and reporting to keep the experience safe and predictable when plans change.